Genetic Base Cow
Topics
2 min read
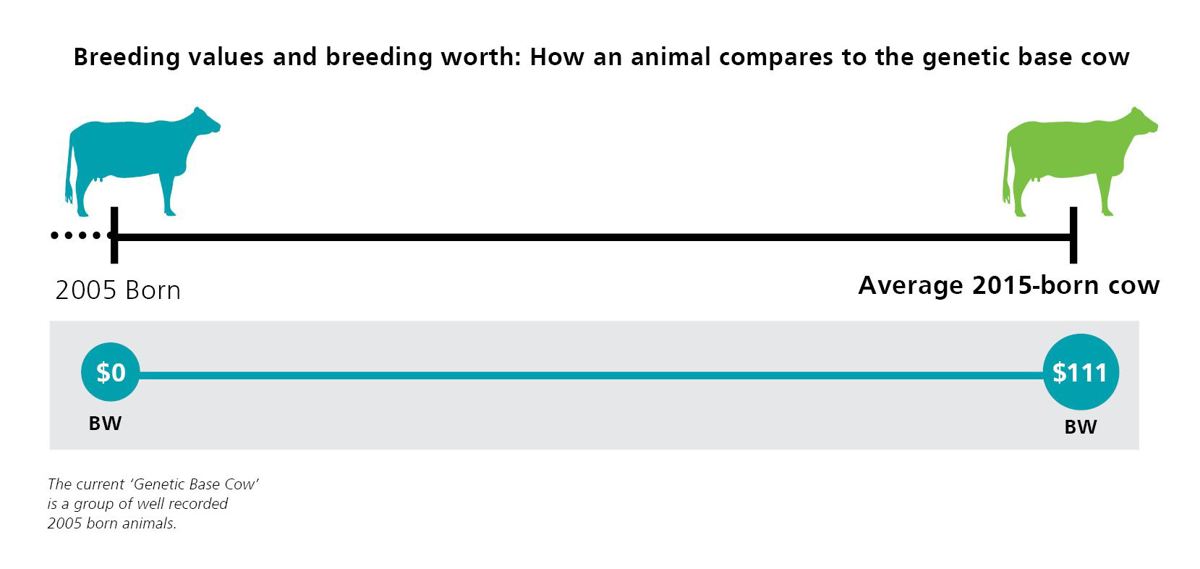
This page covers the concept of a base cow. Breeding Worth (BW) and Breeding Values (BV) are presented as the difference between an animal’s genetic merit and the average genetic merit of the 'base cows’. Read more about the genetic base cow below.
Breeding Worth (BW) and Breeding Values (BV) are presented as the difference between an animal’s genetic merit and the average genetic merit of the 'base cows’.
Every year we see genetic improvement in the national herd; which would lead to the average of each successive crop of replacement heifers coming through having a higher Breeding Worth (BW) than the replacement heifers from previous crops.
To keep the comparison to the genetic base relevant, we routinely update the definition of the base to represent a younger group of cows. As a rule of thumb, the genetic base cow in NZ represents cows from between 10 to 15 years ago. BWs and BVs represent the genetic superiority of an individual animal compared to this base.
Holstein-Friesian
6,617 cows; 31% of cows
Jersey
4,915; 23%
Ayrshire
763; 4%
HF x J
7,917; 37%
Other
1,372; 6%
The same group of cows is used to define the base for all the traits. This group of cows defines the base because they had been scored for Traits Other than Production (TOP) as well as having multiple herd test records in their first, second, third and fourth lactations. Since poor performing cows are culled each year, the cows that define the base represent an above-average cohort of cows from the base year.
The performance of the base cows is dictated by their genetic merit in addition to the way they were managed. Comparing the actual performance of base cows to other animals will not provide insight into the genetic merit of the other animals. The best way to compare the merit of some other group of animals to the base cows is to inspect the BVs and BWs of the other group of animals.
Nevertheless, the average productivity of the base cows is sometimes sought for other reasons, such as for economic models. Accordingly, their mean performance is detailed below.
| Milk production averages - assumed 270-day lactation | ||||
| Lactation | Fat Yield (kg) | Protein Yield (kg) | Milk Volume (L) | Number of cows |
| First | 178 | 139 | 3,768 | 21,565 |
| Second | 213 | 170 | 4,508 | 20,973 |
| Third | 232 | 187 | 4,922 | 20,768 |
| Fourth-sixth | 245 | 198 | 5,266 | 21,339 |
To estimate breeding values for somatic cell, the somatic cell count (SCC) is 'log-transformed' to a somatic cell score (SCS). This is a computing trick to enable us to get the most accurate breeding values for somatic cell, otherwise, a few very large values could unfairly bias the calculations. For this reason, we have provided the average SCS as well as the median SCC. Much like when reporting house prices or household incomes, the median is a more robust measure for summarising somatic cell, where a few very high values could otherwise skew the average.
| Lactation | Average SC score | Median SC count |
| First | 6.0 | 54 |
| Second | 6.0 | 56 |
| Third | 6.2 | 67 |
Genetic base cows were selected if they had herd test records in at least their first four lactations. As such, they had to have been successful at calving in each of those first four years. Their average performance for fertility and functional survival have been calculated here but should not be used for benchmarking cow or herd performance due to the way the base cows are selected.
| Calving period | Calving season day (CSD) | Calving within 42 days of PSC (CR42) |
Presented for mating within |
Functional Survival |
| First | 22 | 88% | 100% | |
| Second | 31 | 74% | 83% | 100% |
| Third | 32 | 71% | 77% | 100% |
| Fourth | 31 | 74% | 79% | 94% |
Historically, very few dairy cattle were weighed as mature cows. For this reason, we have published the average liveweight of the genetic base cows at 2 years of age (n=12,701). We do not recommend that this average is used to forecast or benchmark cow or herd performance for the following reasons:
Please work with your farm consultant to determine the appropriate liveweight benchmarks and/or targets for your herd.
| Trait | Liveweight (kg) | Body Condition Score | Days in milk when weighed/scored |
| Two-year-old | 376.5 | 4.1 | 85 |
Genetic base cows were scored for TOP when they were on average 86 days since calving. Their average scores are as follows:
| Udder conformation | Average Score |
| Udder support | 6.0 |
| Front udder | 5.7 |
| Rear udder | 5.8 |
| Front teat | 4.5 |
| Rear teat | 5.8 |
| Udder overall | 5.7 |
| Teat length* | Assumed 4.2 |
*In December 2021, we began publishing the Teat Length breeding value using records from cows scored since 2017. The genetic base cows born in 2005 were recorded for TOP traits in their 1st lactation in 2007 before teat length was included in the suite of TOP traits. As an approximation of what the base cows might have been, the average teat length score of cows with a teat length breeding value near zero was 4.2.
| Body conformation | Average Score |
| Stature | 5.7 |
| Capacity | 6.3 |
| Rump angle | 4.8 |
| Rump width | 6.2 |
| Legs | 6.2 |
| Dairy conformation | 6.4 |
| Farmer opinion | Average Score |
| Adaptability | 6.1 |
| Shed temperament | 6.3 |
| Milking speed | 6.3 |
| Overall opinion | 6.6 |
The last genetic base cow update was introduced in 2016 and a subsequent update has since been postponed due to the changes in the genetic evaluation that have occurred in the last few years.
It is important to note that a change to the genetic base does not cause any re-ranking among bulls, cows, herds or breeds. It merely shifts all animals up or down equally depending on the genetic base that is chosen.