Forages for Reduced Nitrate Leaching, Bill and Shirley Wright (Canterbury)
8 min read
8 min read
Bill and Shirley Wright own a sheep and beef farm in Cave and are part of the FRNL research network in Canterbury. Their farm spans 360 ha, with specific soil types and an average rainfall of 600 mm. They grow crops like kale, fodder beet, barley, and maize, and keep a variety of livestock. The FRNL project helps them adopt best practices, reduce nitrogen leaching, and improve understanding of environmental impacts. Nitrogen leaching varies with rainfall, soil, and livestock interactions. In 2015/16, variable weather caused changes in pasture production, leading to a drop in beef production and less nitrogen leaching.
Area:
360 ha effective, 378.8 ha total
Dominant soils:
Claremont silty loam, Mairaki silty loam over clay
Dominant soils (others):
Glasnevin stony silty loam
Average rainfall:
approx. 600 mm
Animals:
1000 breeding Coopdale ewes, 130 R1 bulls, 60 R2 bulls
Animals (Heifers):
230 R1 dairy heifers, 230 R2 dairy heifers
Crops grown:
Kale and fodder beet for winter feed, followed by catch crops
Crops grown (late summer/early autumn):
barley and grazing maize
“This programme offered the opportunity to progress our business and to learn best practise to reduce N leaching. As a dry sheep and beef property with dairy grazing the environmental impacts of our business were not yet fully understood. Profitability is driven by innovation and this programme provided that.”
"With the direction the industry is heading, legislation, catchment allocation etc. it’s important to have as much information as possible."
“Gaining understanding and appreciation for a) what we are doing now and b) what we can do going forwards.
The results of the programme inform industry on making better management and crop decisions to increase nutrient uptake and reduce run off.”
The rainfall, soil types, plants and livestock all interact and result in nitrogen (N) leaching. For the years studied, N leaching losses on Bill and Shirley’s farm were low and moderately variable between years. Higher rainfall meant more dry matter production and more stock, which all resulted in greater leaching in better seasons.
Reducing N leaching levels was very difficult, although productivity gains were possible within current leaching levels.
The stand-out year was 2015/16. The low N loss estimate for this season was a result of variable weather which required continuously changing decisions. The summer was dry pre-December, so stocking rates were reduced early, but prolonged rains delivered substantial moisture later in the summer, so lambs were brought onto the farm in the new calendar year. As a result of the weather, pasture production decreased and this was not offset by crops and supplement, leading to a decrease in beef production by 38%. This contributed to a decrease of 27% in N leaching, compared with the previous season.
Total production and estimated N leaching were fairly similar for the other years.
| Farm details | 2014/15 | 2015/16 | 2016/17 | 2017/18 | 2018/19 |
| Beef (kg)1 | 90,145 | 51,652 | 90,788 | 92,210 | 75,740 |
| Sheep meat (kg) | 26,233 | 28,288 | 23,545 | 29,547 | 25,797 |
| Wool (kg) | 7,463 | 6,784 | 7,114 | 8,767 | 5,551 |
| Total animal production (kg) | 123,841 | 86,723 | 121,356 | 130,524 | 107,088 |
| Pasture production (kg DM/ha)2 | 6,909 | 5,641 | 8,307 | 8,425 | 8,345 |
| Total Dry Matter Intake (DMI; kg) | 2,598,127 | 1,601,312 | 2,573,473 | 2,674,706 | 2,334,215 |
| Dry matter intake (Overseer 6.3.1; kg/ha) - total | 7,217 | 4,448 | 7,149 | 7,430 | 6,484 |
| Stocking rate (SU/ha) | 13.3 | 9.4 | 13.3 | 14.8 | 11.7 |
| N leaching (kg N/ha; Overseer 6.3.2) | 15 | 12 | 17 | 19 | 18 |
| N leaching (kg N/kg product; Overseer 6.3.2) | 0.049 | 0.054 | 0.054 | 0.055 | 0.064 |
1 "Beef" means both beef carcass and leaving the farm as live weight gain on grazed dairy cattle.
2 Weighted average from Farmax (natural potential + N fertiliser boosted)
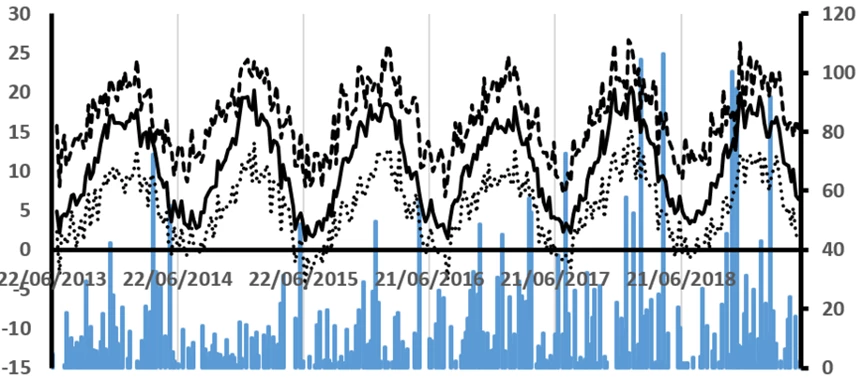
Weekly rainfall (blue bars), air temperature (max dashed line, min dotted line) and soil temperature (solid line) from July 2013 to June 2019 based on interpolated weather data from NIWA’s Virtual Climate Station Network (https://www.niwa.co.nz/climate/our-services/virtual-climate-stations)
Grass-based pasture vs lucerne
Production of grass-based pasture and lucerne was strongly affected by temperature and soil moisture across the four years monitored.
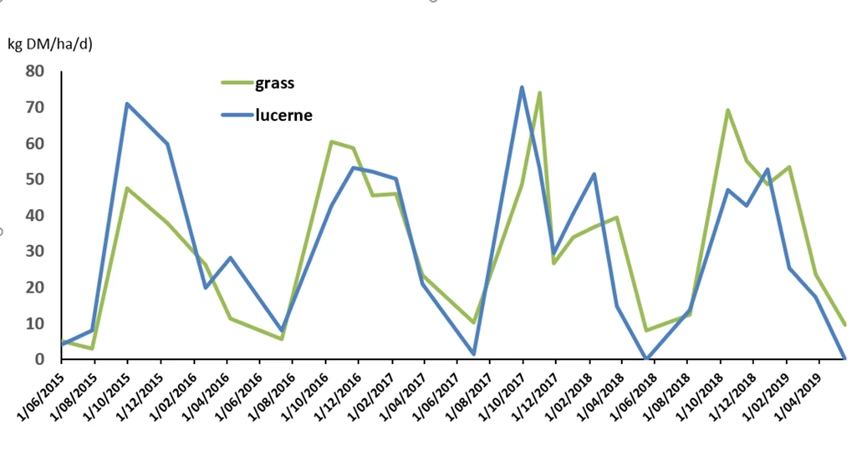
Growth of grass-based and lucerne pastures on Highlands during 4 years to June 2019.
Plantain in diverse pasture
Plantain was incorporated into diverse mixtures on the farm following discoveries about plantain’s potential to reduce N leaching. Pasture production and proportion of plantain in the mix were measured for the 2017-18 and 2018-19 seasons. These young mixed pastures were very productive in comparison with the older grass or lucerne pastures as shown in the table below.
Total dry matter production (kg/ha) assessed using pasture cages from 12th Sept 2017 to 26th Sept 2018 (2017-18), and 26th Sept 2018 to 17th June 2019 (2018-19).
| Name | Sown | Slope | Species | DM kg/ha | |
| 2017-18 | 2018-19 | ||||
| Coles cabbage tree | 2012 | flat | Ryegrass | 10071 | 11198 |
| Coles Patersons 1 | 2013 | flat | Tall fescue | 11872 | 9736 |
| Coles pumphouse 2 | 2013 | flat | Lucerne | 10567 | 7357 |
| Top bottom haybarn | 2016 | flat | Grass-white clover-plantain | 13425 | 10380 |
| Back road flat | 2017 | flat | Grass-white clover-plantain | 16614 | 14182 |
As shown in the figure below the amount of plantain in the pasture mixes was very low and was never more than 13% of the herbage available in the first season, by 2018 there was very little plantain observed, and none in 2019.
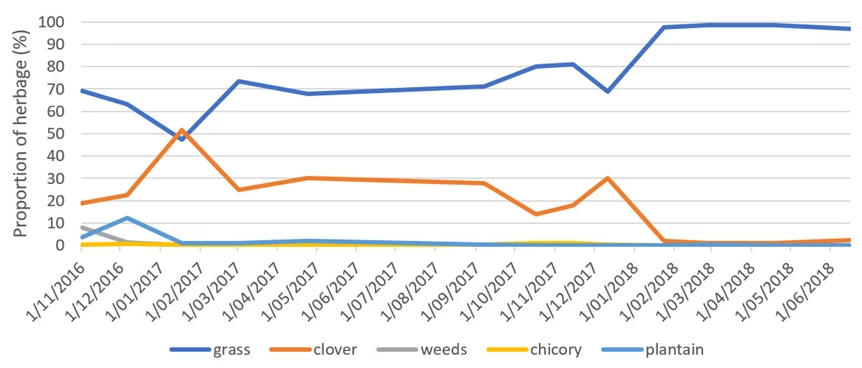
The changes in proportion of plant species in a mixed pasture sown in autumn 2016.
Grazing maize
The use of grazing maize was shown to be more successful on this farm, with its high risk of summer-autumn drought, than growing plantain pastures which have a much lower herbage yield.
The soils and climate on this farm are suitable to grow maize to be used as a forage crop in late summer and autumn. Grazing maize suits this dryland farm very well because feed can be carried from spring and early summer into periods where there is a risk of drought. There is a risk of crop failure, some crops were frosted shortly after sowing but recovered, and in the most recent year a crop was drowned out shortly after sowing. Despite this risk, the crop has given substantial yields in some years, as shown in the table below.
Maize production assessed pre-grazing over five years.
| Year | Paddock name | Date | DM kg/ha | Area of paddock |
| 2015 | ||||
| Roundhill paddocks | 16th Feb | 10,288 | 10.8 | |
| 2016 | ||||
| Trees | 2nd Feb | 8,653 | 8.64 | |
| Trees | 14th Mar | 19,727 | (8.64) | |
| End of lane | 12th Feb | 7,172 | 2.07 | |
| Near Middle creek | 14th Mar | 11,634 | 1.28 | |
| Stables | 14th Mar | 9,354 | 1.92 | |
| 2017 | ||||
| Stables | 1st Mar | 4,200 | 1.92 | |
| Bottom triangle | 11th Mar | 13,820 | 6.45 | |
| 2018 | ||||
| James | 26th Feb | 22,335 | 3.56 | |
| 2019 | Crop failed |
Grazing of maize is not easily represented in the Overseer model. Maize is a low protein feed meaning that the N excreted in the urine is likely to be lower than with pasture.
However, the high crop yields meant that a large number of cattle were required to graze the crop which is likely to leave a significant amount of nitrate in the soil.
On this farm it was best to use the crop in early autumn before the stems resist grazing later in autumn. This also allowed Italian ryegrass or pasture to be sown after grazing, which then functions as a catch crop taking up soil mineral N, reducing risk of N leaching.
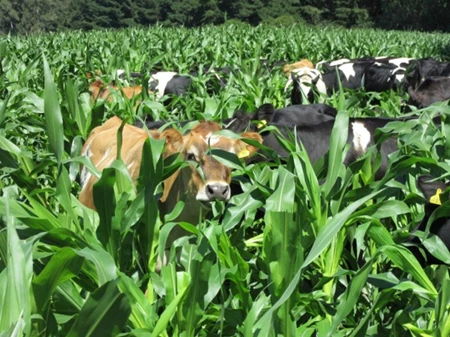
Grazing maize
Catch crops
Earlier sowing of catch crops tended to have a yield advantage and greater cost effectiveness. It is worth considering earlier sowing of catch crops wherever and whenever possible.
Catch crops were shown to reduce the risk of N leaching through their ability to take up N remaining in the soil following winter grazing of fodder crops and appear to be the most appropriate tool to reduce the high N loss risk associated with winter grazing of fodder crops.
A catch crop trial was carried out following a 2018-grazed crop of kale. Catch crops, sowing dates and cultivation are summarised in the table below. There were also control plots which were kept fallow. At the start of November plots were split in half and SustaiN fertiliser was applied to one half of each plot. Final harvest was taken when crops were ready to be taken for whole crop silage, this was 21/12/2018 for triticale, ryecorn and wheat, and 7/1/2019 for the remaining crops.
Total dry matter production (kg/ha) assessed using quadrats within plots on three occasions during the growing season for different species and type and timing of sowing, and application of N in the growing season.
| Species | Timing | Method | 25/10/18 | 20/11/18 | Final harvest | ||
| +N | No N | +N | No N | ||||
| Fallow | - | - | 1,163 | ||||
| Ryecorn | 1/8/2018 | Tilled | 1,189 | 7,626 | 5,392 | 10,903 | 7,695 |
| Triticale | 1/8/2018 | Tilled | 3,000 | 7,382 | 7,061 | 16,563 | 10,276 |
| Wheat | 1/8/2018 | Tilled | 1,419 | 5,840 | 5,186 | 12,650 | 10,550 |
| Oats | 1/8/2018 | Tilled | 1,396 | 9,571 | 7,395 | 11,555 | 11,264 |
| Oats | 1/8/2018 | Direct drilled | 658 | 5,712 | 4,580 | 9,702 | 7,477 |
| Barley | 1/8/2018 | Tilled | 126 | 6,289 | 5,084 | 10,686 | 8,240 |
| Barley | 18/9/2018 | Tilled | - | 2,468 | 2,399 | 8,744 | 7,472 |
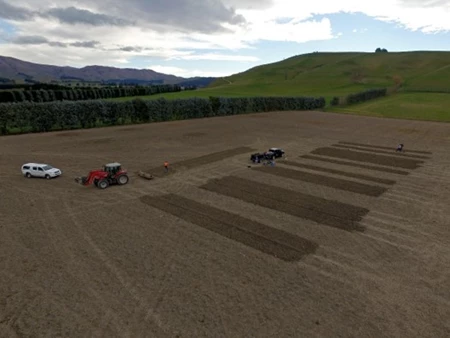
Catch crop trial 2018.
Download the full report on the Sheep and Beef monitor farms, including the catch crop results, here.